Visualizing Complex Data: Creative Approaches to Code Art

Understanding the Importance of Data Visualization
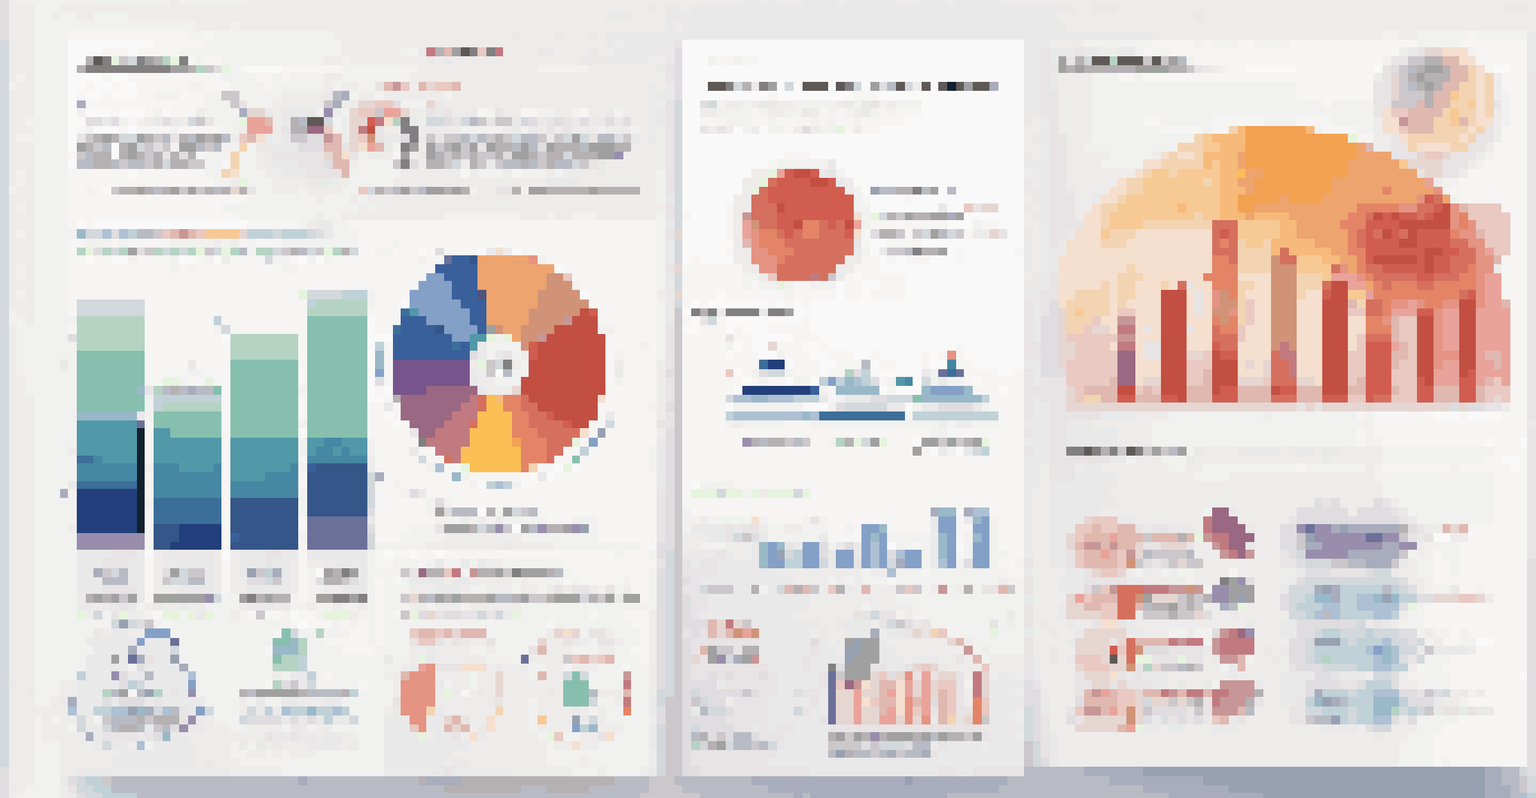
Data visualization transforms complex datasets into visual formats that are easier for our brains to understand. Imagine trying to read a lengthy report filled with numbers; it can feel overwhelming! Now, picture that same data displayed in a colorful chart or an eye-catching infographic. That's the power of visualization—it helps us see patterns, trends, and insights that might otherwise go unnoticed.
Data is the new oil. It’s valuable, but if unrefined it cannot really be used.
In a world where data is generated at an unprecedented rate, effective visualization is crucial for making informed decisions. For instance, businesses use visual data representations to track sales performance or customer behavior, allowing them to pivot strategies quickly. Similarly, researchers can better communicate their findings through visuals, making their work accessible to a broader audience.
Ultimately, effective data visualization not only aids in comprehension but also enhances engagement. When people can visualize data, they are more likely to connect with it emotionally and intellectually. This connection fosters a deeper understanding, leading to more informed discussions and actions based on the data presented.
Diving into Code Art: What Is It?
Code art refers to the practice of using programming languages to create artistic visualizations of data. Think of it as a blend of technology and creativity, where algorithms generate stunning graphics that tell a story. For instance, artists can write code to turn complex statistical data into mesmerizing patterns or animations, inviting viewers to explore the data in an interactive way.

This approach not only elevates the aesthetic quality of data presentation but also encourages exploration. Instead of passively consuming information, viewers become active participants, engaging with the data on their own terms. This interactivity can lead to unexpected discoveries and insights, fostering a more comprehensive understanding of the underlying data.
Data Visualization Simplifies Understanding
Transforming complex datasets into visual formats helps individuals recognize patterns and insights more easily.
Moreover, code art can serve as a bridge between technical and non-technical audiences. By presenting data visually, artists can make complex information accessible to everyone, regardless of their background. This democratization of data understanding is vital in today's information-rich society.
Harnessing the Power of Color in Data Visualization
Color plays a pivotal role in data visualization, influencing how we perceive and interpret information. Different colors evoke various emotions and reactions, which can enhance or hinder the message being conveyed. For example, using red to indicate danger or loss can immediately capture attention, while green often signifies growth or safety.
The goal is to turn data into information, and information into insight.
In code art, the choice of color can transform a simple dataset into a compelling visual narrative. By selecting a thoughtful color palette, artists can highlight key trends or anomalies within the data. This can lead to more profound insights, as viewers can quickly identify areas of interest or concern without sifting through endless numbers.
However, it's essential to use color strategically. Overloading a visualization with too many colors can create confusion rather than clarity. A balanced approach, with a limited but purposeful color scheme, can make a significant difference. By doing so, artists can guide the viewer's eye to where it matters most, ensuring the data's story is both engaging and understandable.
Interactive Visualizations: Engaging Your Audience
Interactive visualizations take data presentation to the next level by allowing users to engage directly with the data. Imagine hovering over a point on a graph to reveal additional information or filtering a dataset to view specific trends. This level of interactivity invites curiosity and exploration, making the data experience more personal and impactful.
In the realm of code art, creating interactive elements can significantly enhance audience engagement. Artists can use various programming libraries and frameworks, like D3.js or Processing, to develop dynamic visualizations that respond to user input. This not only captivates the audience but also empowers them to discover insights at their own pace.
Code Art Merges Creativity and Tech
Using programming languages to create artistic visualizations invites exploration and makes data accessible to all.
Furthermore, interactive visualizations can cater to diverse learning styles. Some people prefer visual information, while others benefit from hands-on experiences. By merging these approaches, artists can create a more inclusive environment where everyone can connect with the data meaningfully.
Using Data Storytelling to Enhance Visualizations
Data storytelling weaves together data and narrative to create a compelling story that resonates with the audience. Much like a good book, a well-crafted data story has characters (data points), a plot (trends), and a conclusion (insights). This narrative framework can make complex data more relatable and easier to understand.
Incorporating storytelling elements into code art can significantly enhance its impact. For instance, an artist might create a timeline visualization that charts a company's growth over the years, accompanied by key milestones that highlight significant events. This narrative approach not only informs but also engages the audience emotionally.
By framing data within a story, artists can guide viewers through the visualization, emphasizing specific points and encouraging reflection. This technique transforms raw data into a captivating journey, prompting audiences to think critically about the information presented and its implications.
Tools and Technologies for Code Art
Creating stunning code art requires the right tools and technologies. Thankfully, there are numerous programming languages and libraries designed specifically for data visualization and artistic creation. Popular choices include JavaScript libraries like D3.js for interactive graphics, Processing for generative art, and Python's Matplotlib for static visualizations.
Each tool offers unique features and capabilities, catering to different artistic visions and technical skills. For instance, D3.js allows for highly customizable and interactive visualizations, while Processing is excellent for artists focused on creative coding and generative design. The right choice depends on the desired outcome and the artist's familiarity with the tool.
Interactivity Enhances Data Engagement
Interactive visualizations allow users to engage directly with data, fostering curiosity and deeper understanding.
Moreover, the availability of open-source resources and community support makes it easier for aspiring artists to get started. Online tutorials, forums, and collaborative platforms can help individuals hone their skills and share their creations. This accessibility encourages experimentation and innovation in the realm of code art.
The Future of Visualizing Data with Code Art
As technology continues to evolve, so too will the ways we visualize data through code art. Advancements in artificial intelligence and machine learning are opening up new possibilities for generating dynamic visualizations that adapt in real-time. Imagine a visualization that changes based on live data feeds, providing instant insights to viewers.
Moreover, the growing emphasis on data literacy means that visualizations will play an increasingly vital role in education and communication. As more people recognize the importance of understanding data, the demand for creative and effective visual representations will rise. Artists and technologists alike will need to collaborate to meet this demand.
Ultimately, the future of code art lies in its ability to bridge the gap between data and human understanding. By continuing to innovate and explore creative approaches, we can make complex data more accessible and engaging for everyone. Embracing this evolution will empower individuals and organizations to harness the full potential of their data.